If all you have is a hammer, everything will eventually start looking like a nail. This is generally known as Maslow’s hammer and refers to the fact that you use the tools you know to solve any problem, regardless if that’s what the problem actually needs. With that said, I frequently need a way to visualize the load distribution of scheduled jobs over a day or week, but I could never be bothered to set up a web server, learn a procedural programming language or build custom visualizations in PowerBI.
So here’s how to do that without leaving Management Studio.
The data
SQL Server Agent uses a number of tables in the msdb database to store information about jobs, steps, scheduling and execution history. We’re going to focus on dbo.sysjobhistory, where the execution history is stored, and dbo.sysjobs, where the names of all the jobs can be found.
The visualization
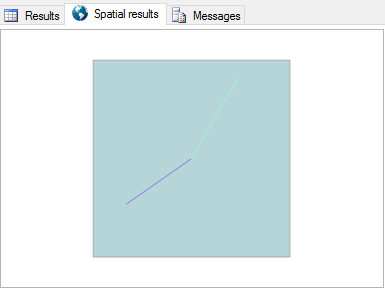
Most readers may not realize this, but when you return a recordset to SQL Server Management Studio that contains a column with a spatial datatype, SMSS will actually render the data for you visually in a two-dimensional grid. Try this for a taste:
DECLARE @hour_hand float=DATEPART(hour, SYSDATETIME())%12+1.0*DATEPART(minute, SYSDATETIME())/60;
DECLARE @minute_hand float=DATEPART(minute, SYSDATETIME());

SELECT geometry::STGeomFromText('POLYGON ((-1 -1, -1 1, 1 1, 1 -1, -1 -1))', 0)
UNION ALL
SELECT geometry::STGeomFromText(q.wkt, 0)
FROM (
    VALUES --- The hour hand
           (0.8*COS(2.0*PI()*@hour_hand/12),
            0.8*SIN(2.0*PI()*@hour_hand/12)),
           --- The minute hand
           (0.95*COS(2.0*PI()*@minute_hand/60),
            0.95*SIN(2.0*PI()*@minute_hand/60))
    ) AS p(s, c)
CROSS APPLY (
    VALUES ('LINESTRING (0 0, '+STR(p.c, 5, 4)+' '+STR(p.s, 5, 4)+')')
    ) AS q(wkt);
Click on the “Spatial results” tab:

The full monty
Yep. With a little bit more code (actually a lot more code), you can generate a whole timeline diagram of all the job executions.

You can download the full script on the Downloads page. There are some parameters you might want to adjust:
- @from: the starting date/time of the diagram
- @to: the ending date/time of the diagram
- @grid: optional, if you want to add a vertical, this parameter specifies the width of the grid. The default is one day.
- @status: optional, if you want to filter on a specific outcome, like successful, failed or retried jobs. Leave this set to NULL to include all job executions.
More reading:
- The geometry datatype on MSDN
- The well-known text (WKT) format on Wikipedia
Hi,
nice script Daniel. Works good on some servers but gives the following errors on some.
Is it related to SQL Server version ?
/Staffan
Msg 6522, Level 16, State 1, Line 48
A .NET Framework error occurred during execution of user-defined routine or aggregate “geometry”:
System.FormatException: 24305: The Polygon input is not valid because the ring does not have enough distinct points. Each ring of a polygon must contain at least three distinct points.
System.FormatException:
at Microsoft.SqlServer.Types.Validator.Execute(Transition transition)
at Microsoft.SqlServer.Types.ForwardingGeoDataSink.EndFigure()
at Microsoft.SqlServer.Types.OpenGisWktReader.ParseLineStringText()
at Microsoft.SqlServer.Types.OpenGisWktReader.ParsePolygonText()
at Microsoft.SqlServer.Types.OpenGisWktReader.ParseTaggedText(OpenGisType type)
at Microsoft.SqlServer.Types.OpenGisWktReader.Read(OpenGisType type, Int32 srid)
at Microsoft.SqlServer.Types.SqlGeometry.GeometryFromText(OpenGisType type, SqlChars text, Int32 srid)
.
Sounds like a problem with the inputs perhaps. Possibly a job that runs for zero seconds or something like that?
Staffan, I added a filter at the end before the semicolon, that helped fix that error:
and h.run_duration>10
Thanks
Script is not found on the downloads page as of 2023-May-15.
Joe S – it’s under “Gists and other hacks”. Search for “Visual representation of SQL Server Agent job schedules”.