![]() In the two previous parts of this series, we’ve looked at how parallelism works, how you can control it, and how it affects your query (and server) performance in different environments. In this, the third part, we’re going to take a more technical look at how the different Parallelism operators work.
In the two previous parts of this series, we’ve looked at how parallelism works, how you can control it, and how it affects your query (and server) performance in different environments. In this, the third part, we’re going to take a more technical look at how the different Parallelism operators work.
There are two query plan operators that can create a parallel “zone”, Distribute Streams and Repartition Streams. Also known as “exchange operators”, these two signal the start of a parallel zone because they produce a number of streams that can be consumed by parallel operators.
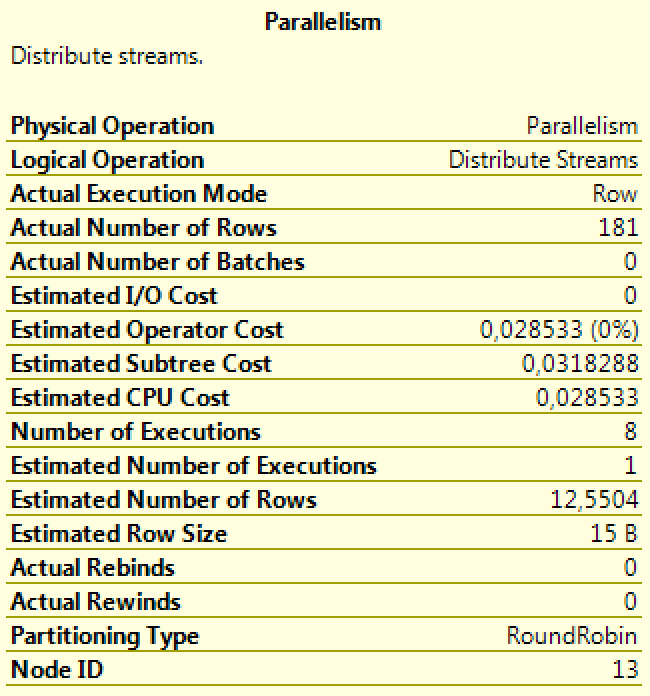
 Depending on a number of factors, SQL Server will choose from a number of methods to distribute the input stream(s) to the output streams, known as partitioning types. This affects the partitioning and ordering of the data when consumed by the parallel operators that follow. You can view the partitioning type chosen by SQL Server by hovering over the exchange operator in the graphical query plan. The most common types you’ll encounter are:
RoundRobin
The first row goes to the first output stream, the second row to the second stream, and so on. When each stream has received one row, the next row is once again sent to the first stream. This ensures a very even distribution of rows across the different output streams.
Hash
Like it sounds, a hash value is calculated for one or more columns that determines which stream each row should be sent to. Hashing effectively partitions the data, which collects all rows with the same hash values in the same output streams.
Broadcast
Sends each row to all of the streams.
Demand partitioning
There’s another way to start a parallel zone that I haven’t mentioned: The Index Scan. Most operators in a query plan are in themselves serial, in the sense that they are blissfully unaware of the parallelism going on around them – they feed on a single stream and output the result of whatever they do to an output stream. When you run a parallel index scan, however, it can create multiple output streams.
Clarification: For the purpose of brevity, I’ve described the logical data flows in an execution plan as operators pushing data upwards in the tree. This is in fact not exactly the case. What really happens is that the left-most operator in every query plan requests (i.e. pulls) data from the next operator down the line, which in turn will pull data from the next operator, etc. This may seem like a purely theoretical point to make, but it does makes a difference when we look at the scan operator.
When a (parallel) index scan reads data, it allocates data pages (4 kB blocks of data) to the next available thread. For this to work, each thread signals its availability by requesting another page. This creates a type of load balancing, where pages are distributed evenly across threads in accordance with how much load each thread can take on. Hopefully, this results in all the threads running for about the same amount of time, which is crucial to good query performance.
Credits and sources
For the posts in this series, I’ve mainly looked to Adam Machanic‘s and Craig Freedman‘s excellent work.